 "Future Heap Owner" (aperiodic)
03/19/2019 at 02:12 • Filed to: mappositelock, Maps
 4
4
 13
13|
"Future Heap Owner" (aperiodic)
03/19/2019 at 02:12 • Filed to: mappositelock, Maps | 4
| 13 |
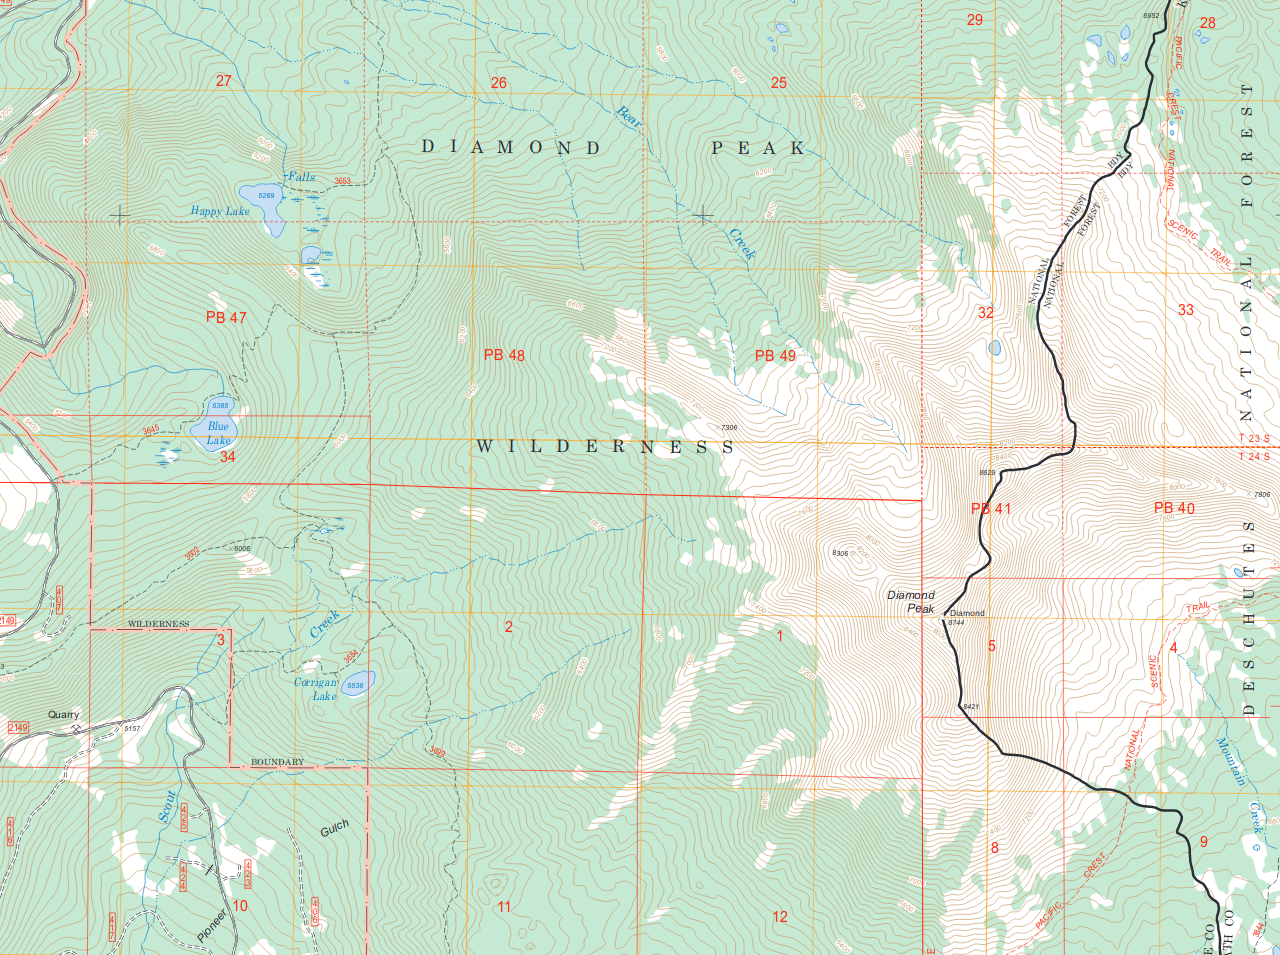
I like looking at Forest Service topographic maps so much. Making these maps is one of the best things the US f ederal g overnment does.
 TheRealBicycleBuck
> Future Heap Owner
TheRealBicycleBuck
> Future Heap Owner
03/19/2019 at 07:03 |
|
Fun facts:
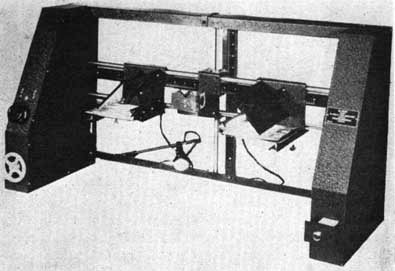
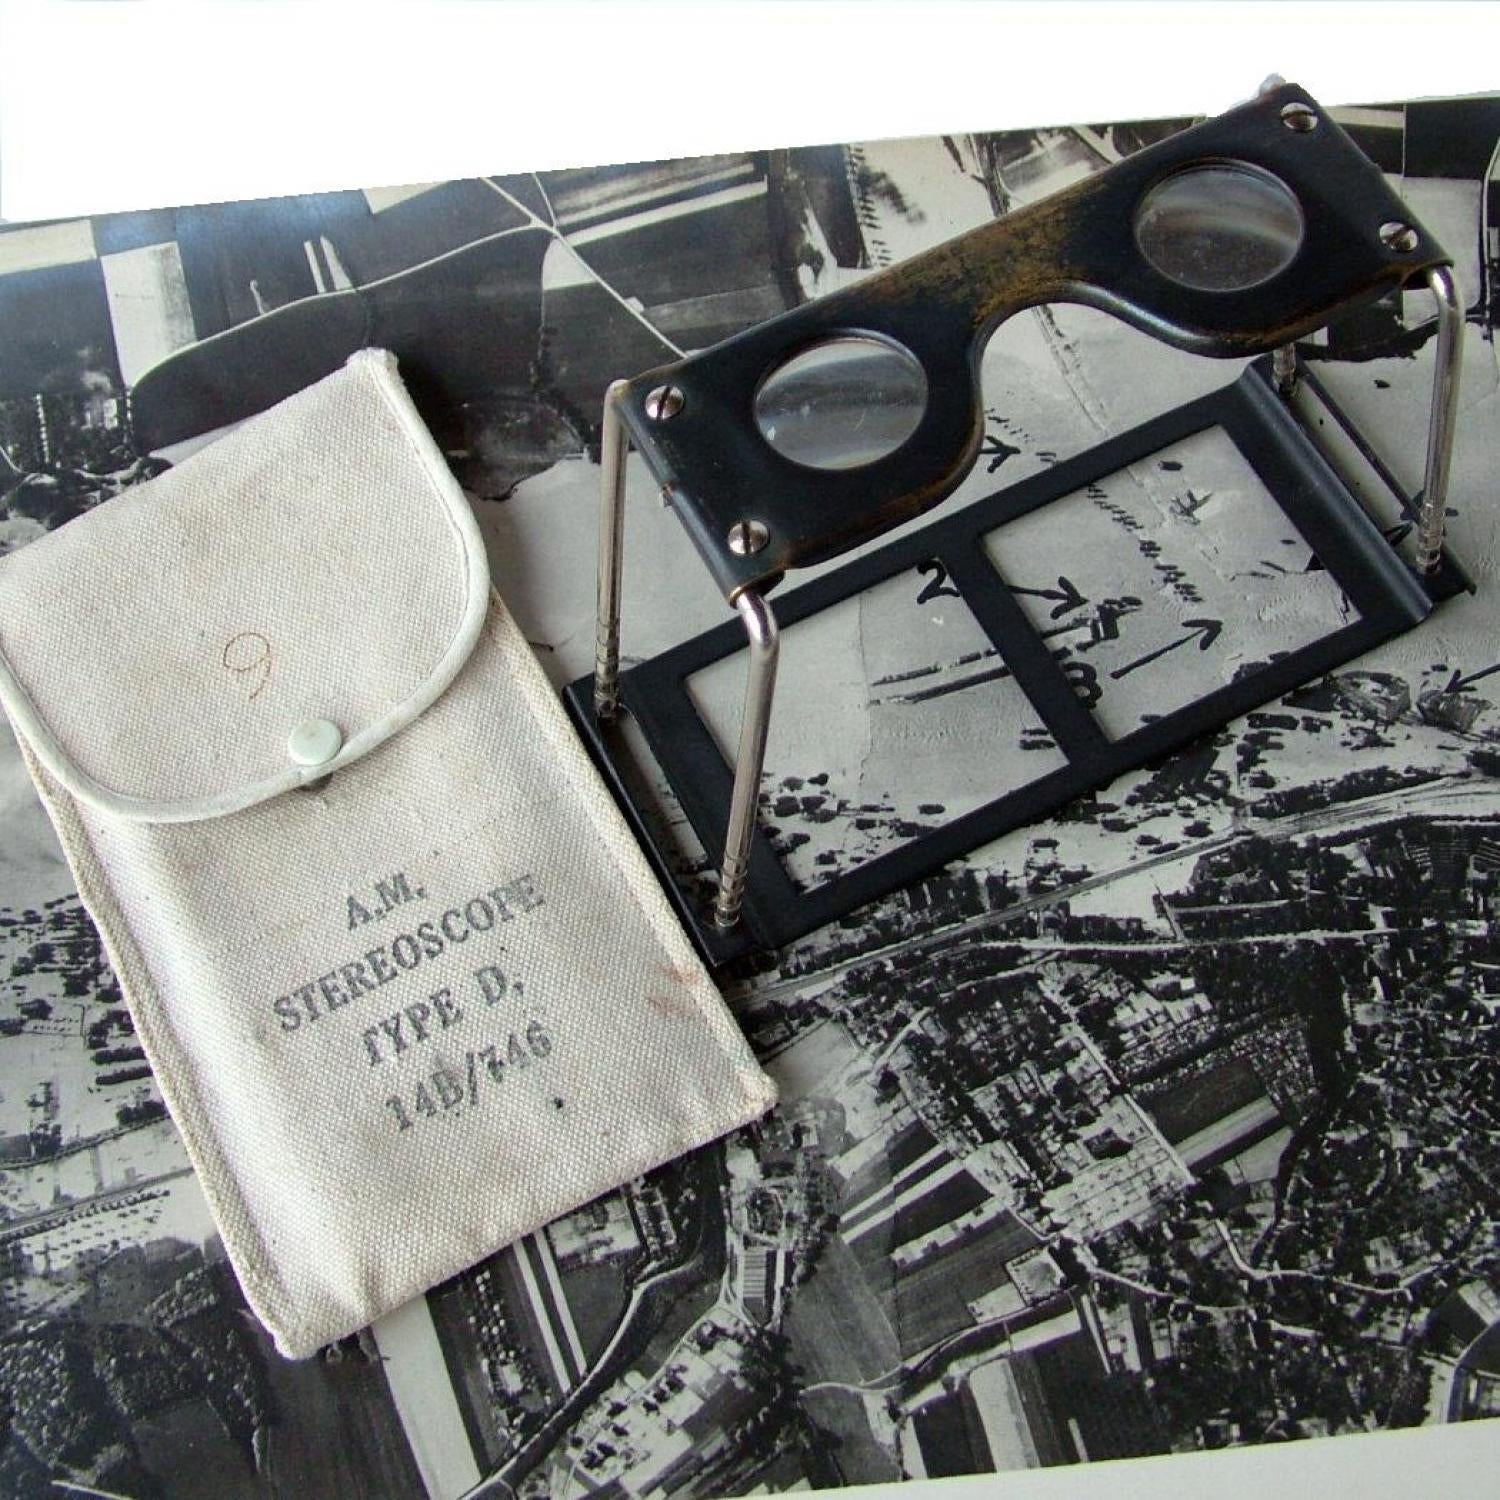
All of these were originally produced using photogrammatry techniques at 1:24,000 scale by hand .
A stereoscope was used for taking measurements directly from photo pairs which are manually aligned using common observable objects in each photo pair .
At 1:24,000 scale, a #2 pencil line drawn on the map would be 157 feet wide in the real world.
What was once interpreted by hand is now accomplished using algorithms in software. A key component which makes this possible is automatically identifying common objects or points of reference in overlapping photos.
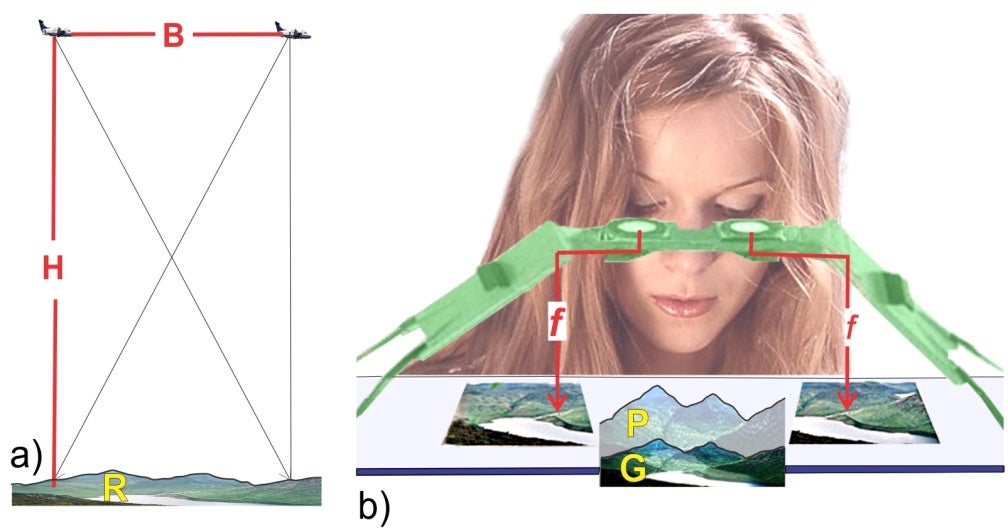
The math for accurately measuring heights from aerial photos takes into account the geometry of the camera system used to take the photo , including details about aberrations within the camera lens itself.
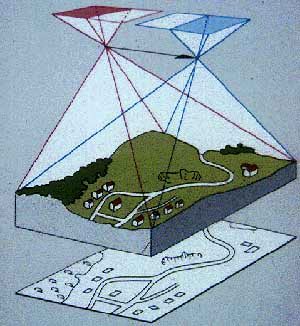
Orthophotogrammetry “corrects” aerial photos, removing errors due to oblique angles and differences in elevation. The goal is to get everything to the same scale on a common plane so that measurements taken from the photos are correct, i.e. the road width is the same whether measured at the top of the mountain or in the valley below.
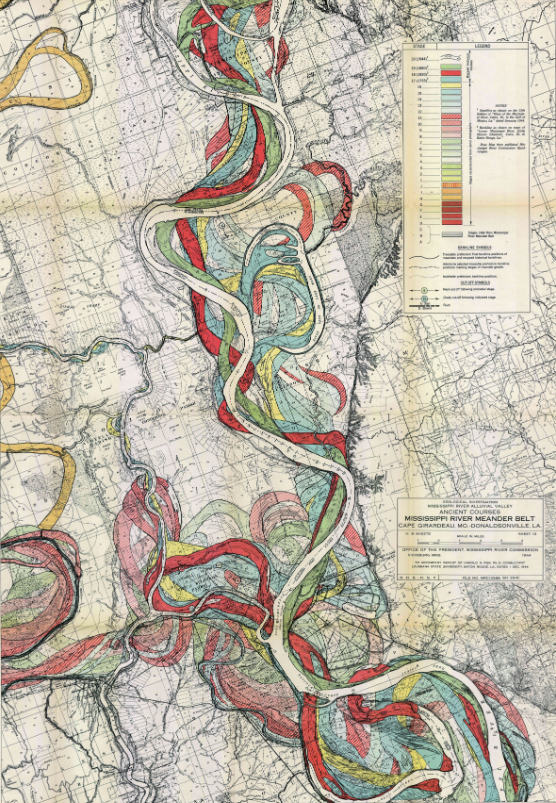
I have a thing for maps and aerial imagery too . If you like topo maps, you might also like one of my favorite plate sets, Geological Investigation of the Alluvial Valley of the Lower Mississippi River, published by the Army Corps of Engineers in 1944.
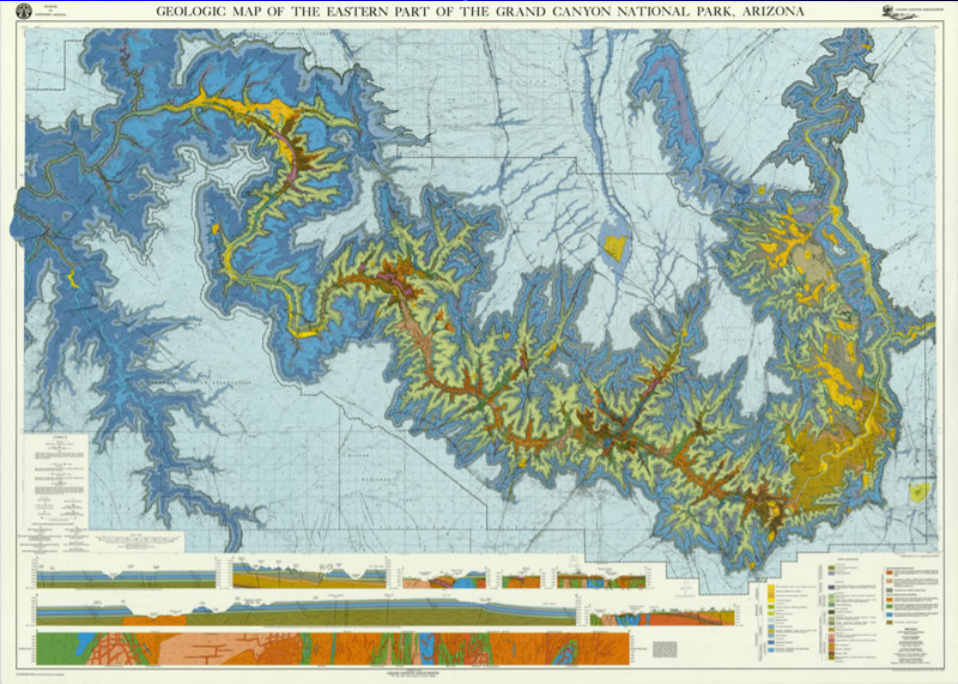
I always like maps, but really got hooked when I we visited the Grand Canyon. The gift shop had a geologic map of the c anyon hanging on the wall and it was AMAZING! I bought a copy which I hung in my room until I got married. If I ever get my own office space again, that sucker’s going right back on t he wall!
 Neil drives a beetle and a fancy beetle
> Future Heap Owner
Neil drives a beetle and a fancy beetle
> Future Heap Owner
03/19/2019 at 09:39 |
|
I agree wholeheartedly. Also; diamond peak is definetly an Oregon mountain but I can’t place it in my head for some reason.
|
Future Heap Owner
> Neil drives a beetle and a fancy beetle
03/19/2019 at 10:31 |
|
Good recognition! It’s i n the Southern Oregon Cascades, just a couple dozen miles north of Crater Lake, near Odell Lake outside of La Pine.
|
Future Heap Owner
> TheRealBicycleBuck
03/19/2019 at 10:40 |
|
Oh man, thanks for all those fun facts! Making this kind of map by hand seems like quite an undertaking.
Re: your last fact: you mean they remove perspective and basically d e-render the photo into 2D? Neat! They did this by hand after constructing a height map?!
That lower Mississippi map is gorgeous. You know, this gives me ideas of what to put on all these blank walls I have...
 vicali
> Future Heap Owner
vicali
> Future Heap Owner
03/19/2019 at 11:26 |
|
This is going to be one of my next projects, I just need to pick a location
.
Start with DEM and make contours;
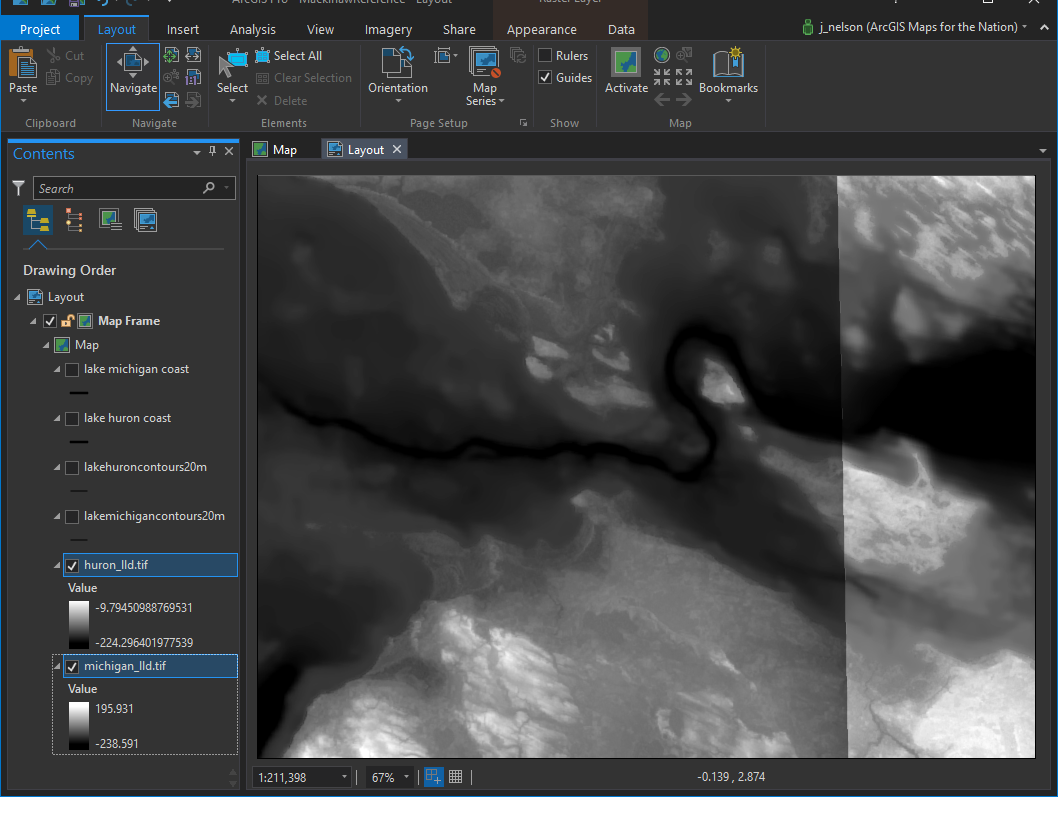
transpose to paper;
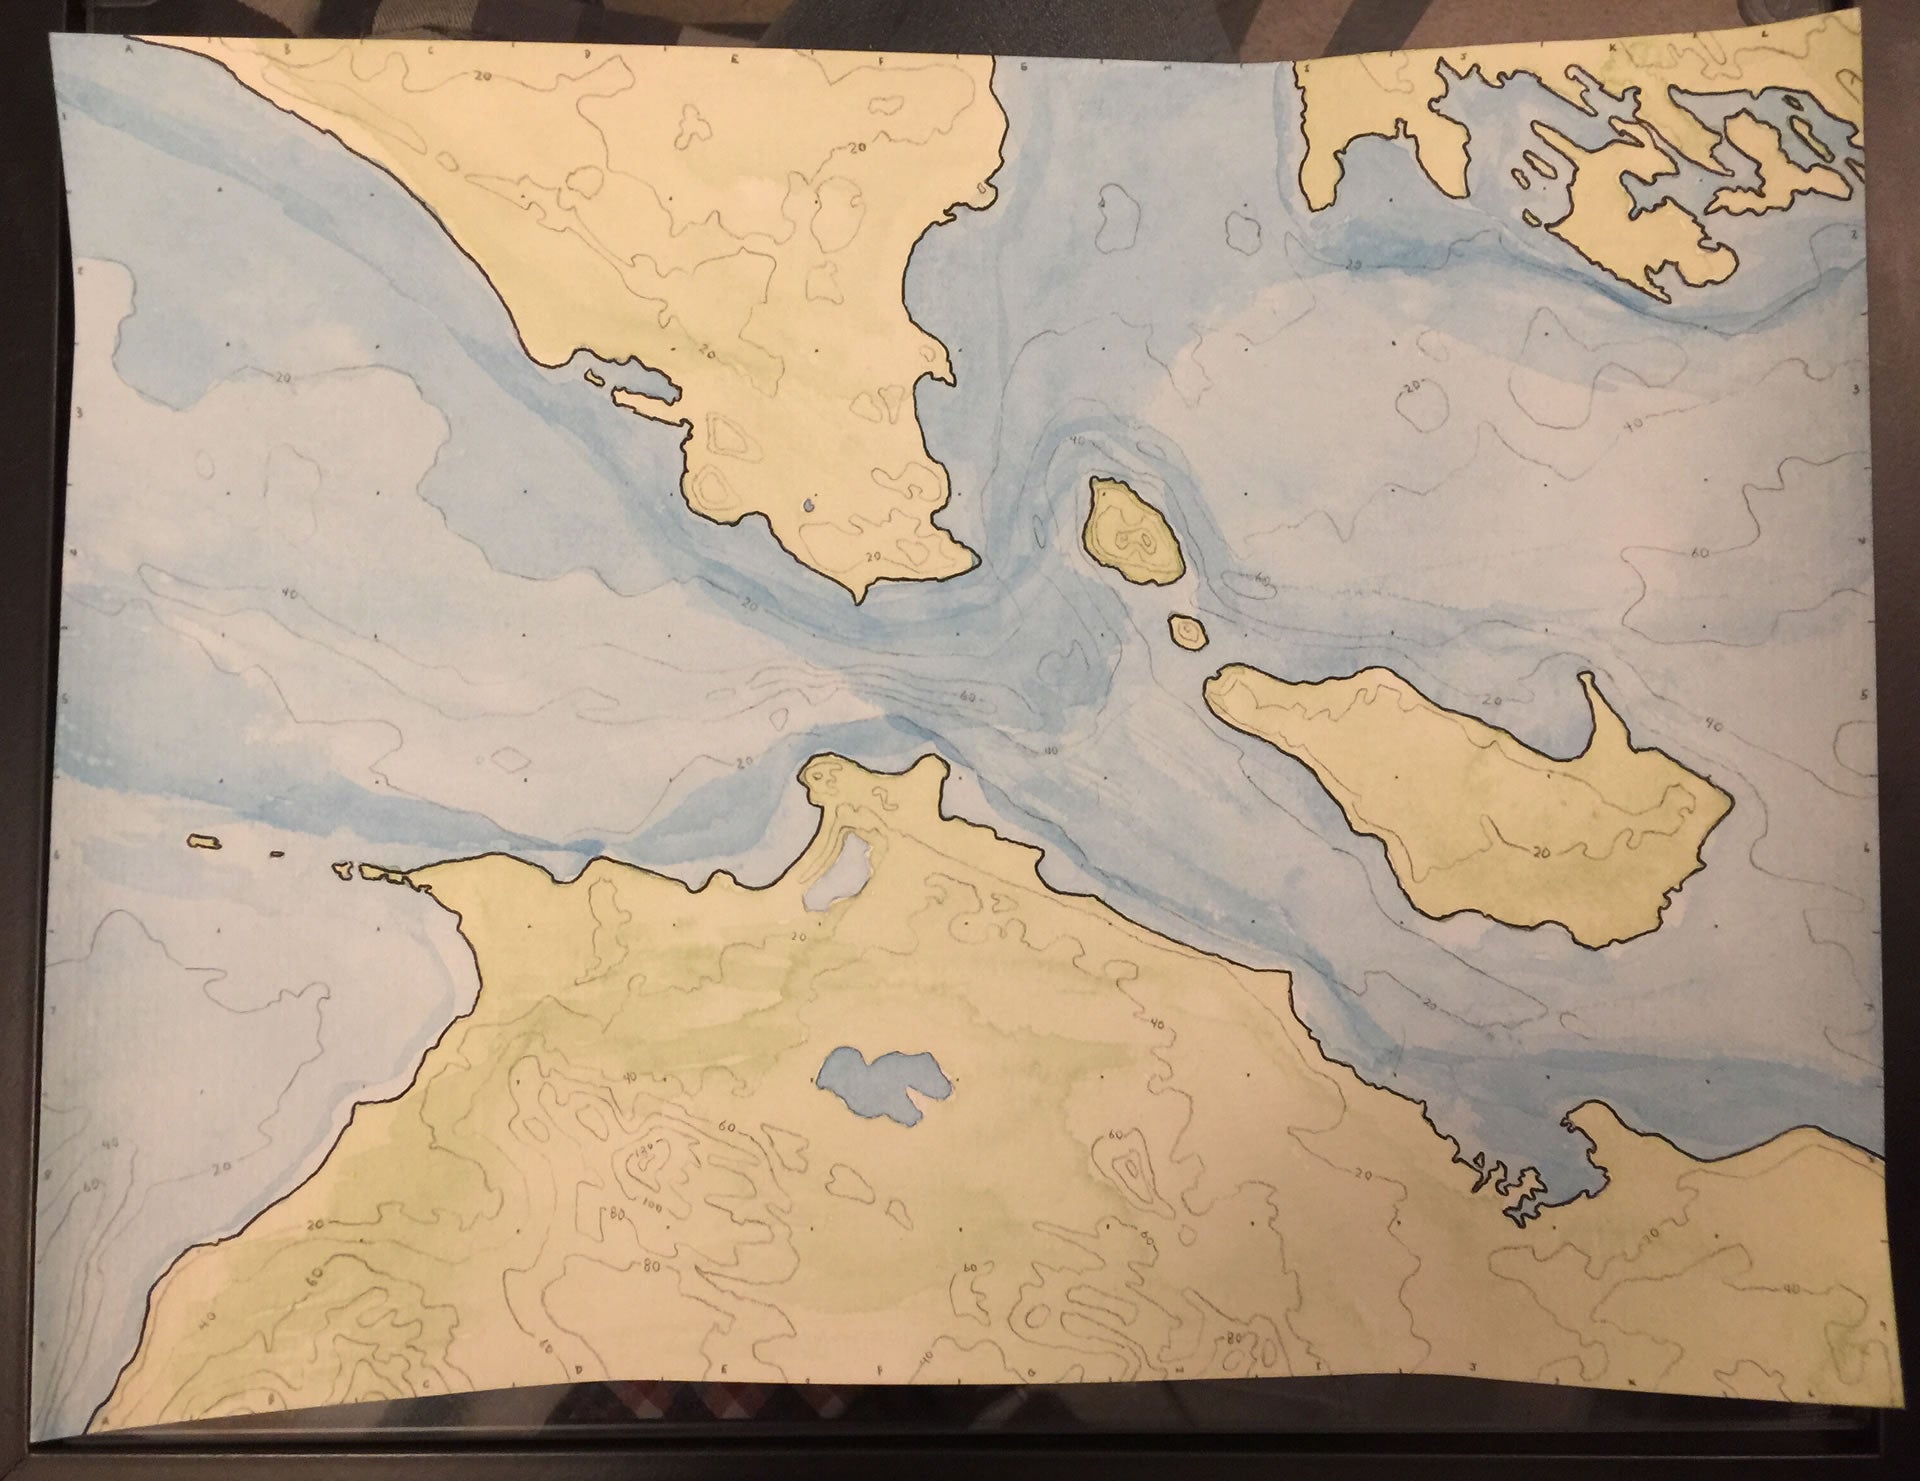
add details;
|
Future Heap Owner
> vicali
03/19/2019 at 11:29 |
|
Beautiful. Reminds me of the maps in so many paperback books I read as a child.
 MattHurting
> Future Heap Owner
MattHurting
> Future Heap Owner
03/19/2019 at 11:31 |
|
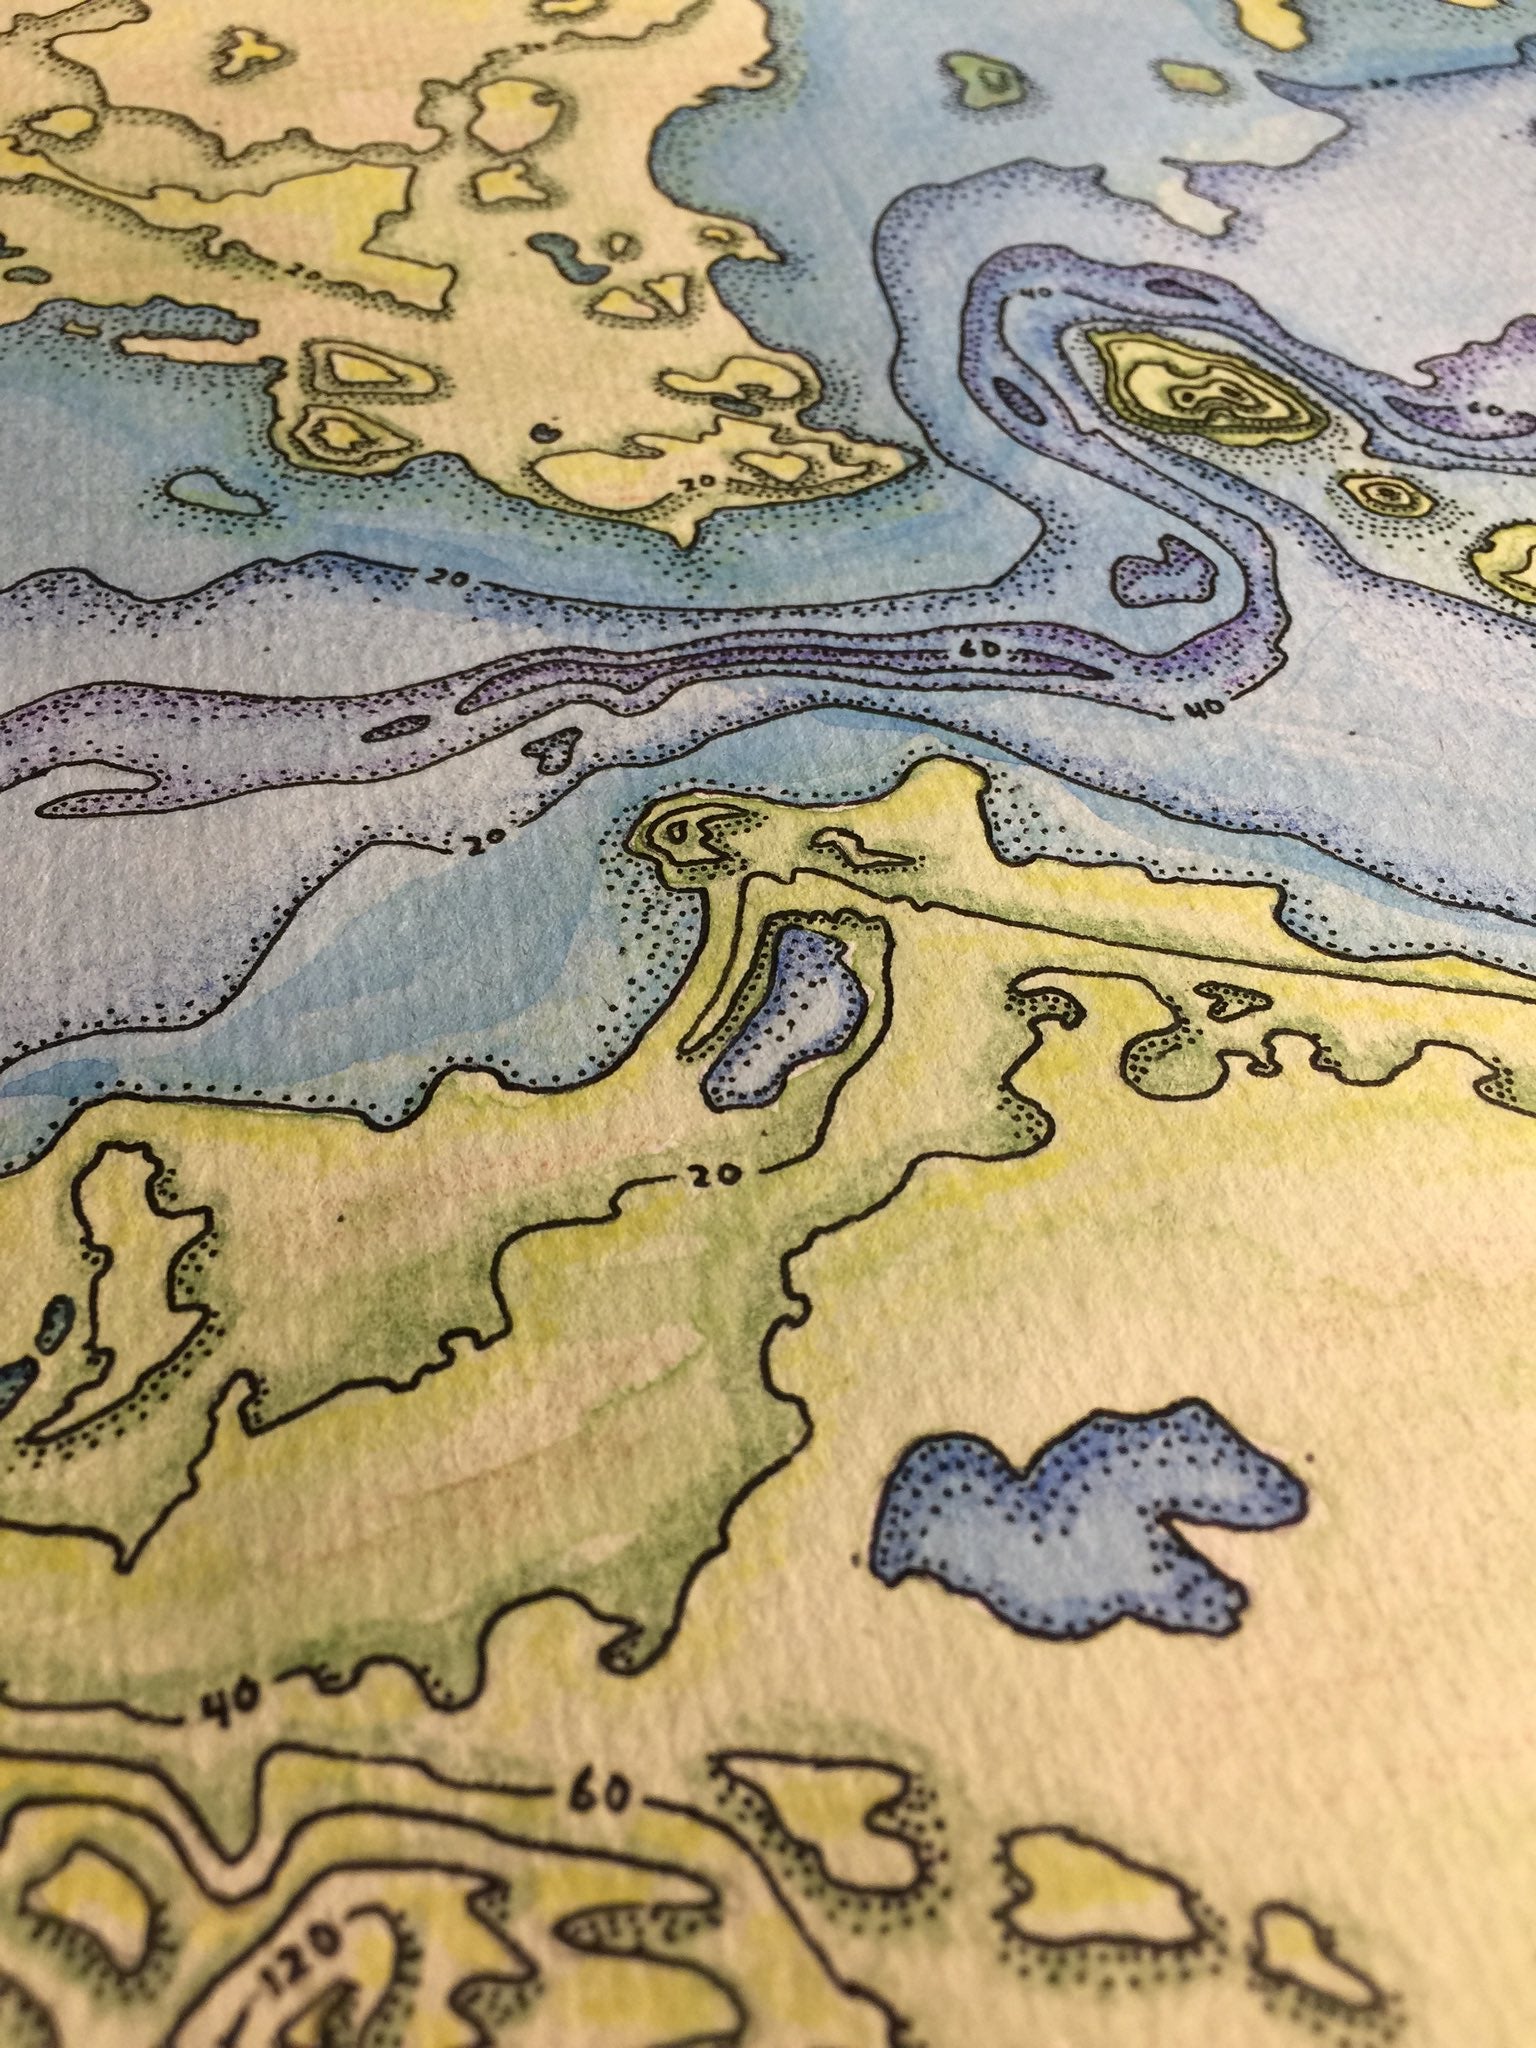
I’ll add another fun fact: the “turnbacks” where the contour lines cross water point towards the source of the water. Or another way to look at it would be to say the cup pours down the hill.
|
MattHurting
> TheRealBicycleBuck
03/19/2019 at 11:32 |
|
Great info there. My bachelor’s degree is in geography and we studied a lot of the older stereoscopic methods from back in the day.
|
MattHurting
> Future Heap Owner
03/19/2019 at 11:39 |
|
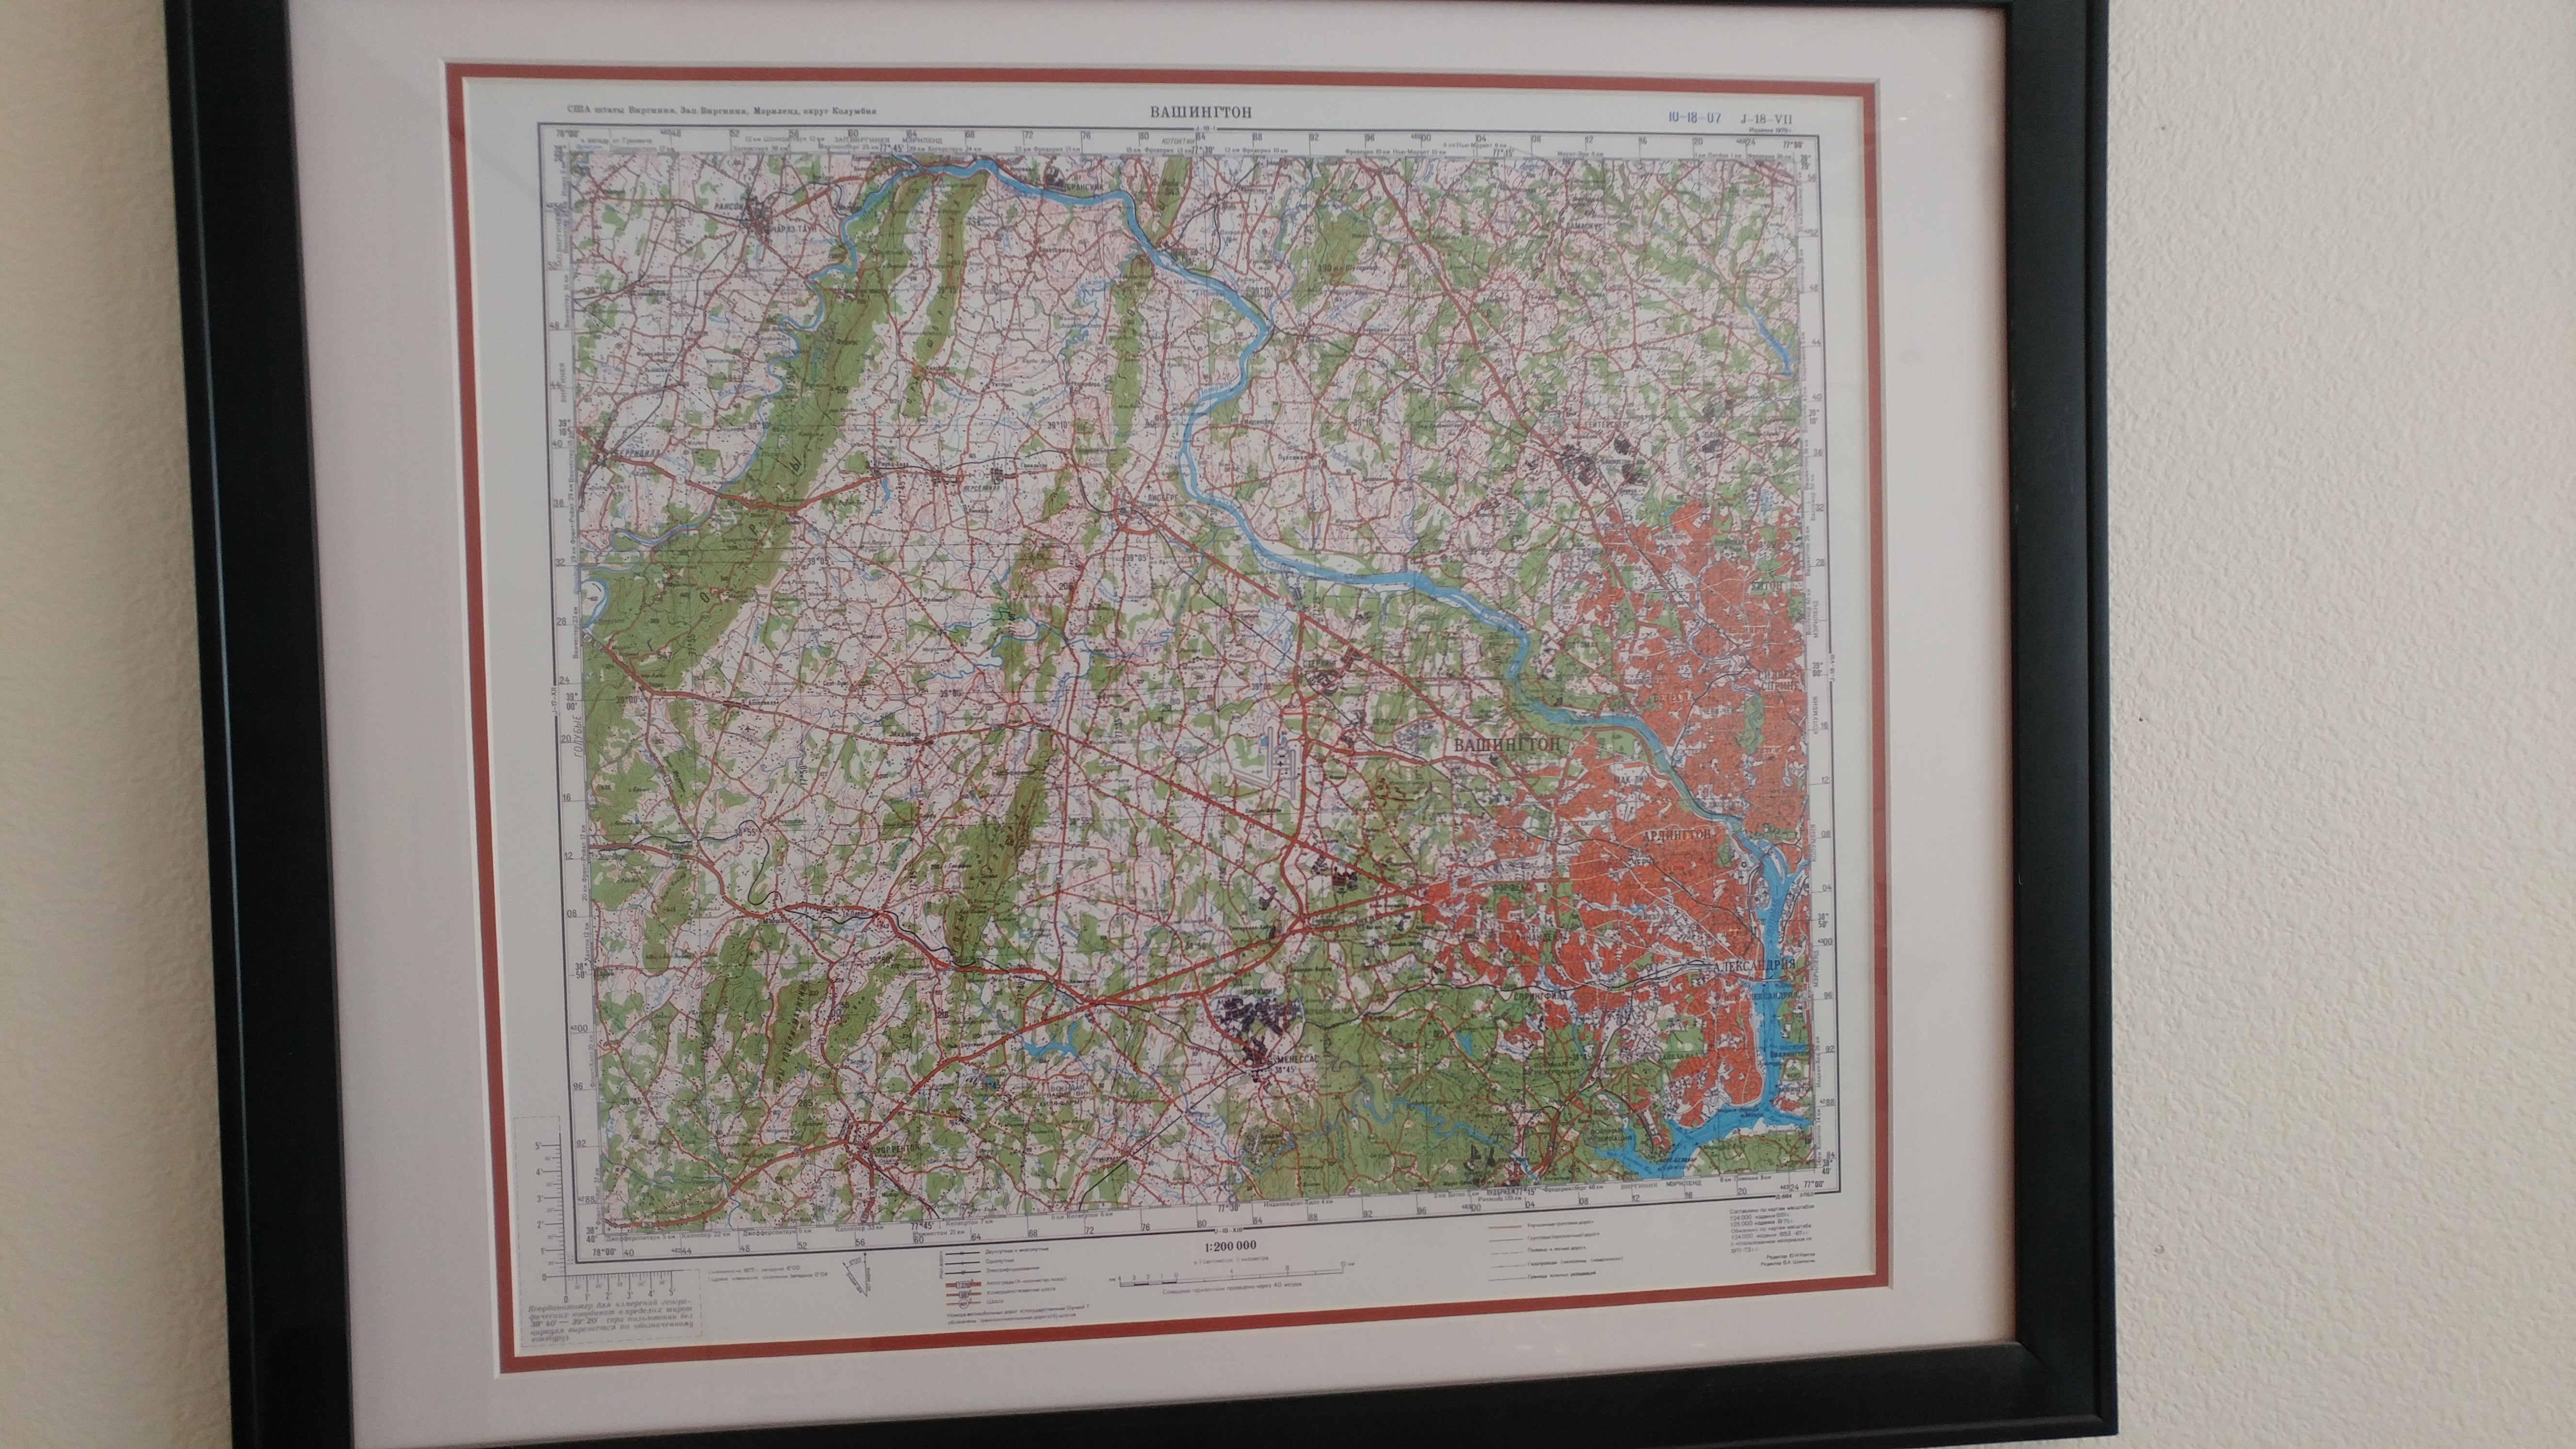
Check out this map, a 1:200K scale Russian map of Washington DC and surrounding areas from 1977. It’s quite accurate.
|
vicali
> TheRealBicycleBuck
03/19/2019 at 11:40 |
|
Ha, I spent a lot of time looking through stereoscopes; carried a pair around in my vest for airphotos all the time.
|
TheRealBicycleBuck
> Future Heap Owner
03/19/2019 at 11:48 |
|
When we started moving toward digital, converting all of those maps was just as big an undertaking as making the originals. The oldest method was to tape an original paper map onto a digitizing table and trace all of the objects into a PC. This was fraught with errors, most of them human. However, paper maps shrink and swell as the humidity changes, so maps digitized in a dry climate would be slightly smaller than those digitized in a humid climate. That threw off all the scales. The next attempt was to scan the maps so digitally extracting the data could be done in a PC. The same shrink/swell problems affected the scans.
Orthorectification didn’t come into play until the digital elevation data was developed and photos could be scanned and manipulated digitally. Before then, you had to know the elevation in relation to the location so the correct scale was used when taking measurements directly from the photos.
|
TheRealBicycleBuck
> vicali
03/19/2019 at 13:29 |
|
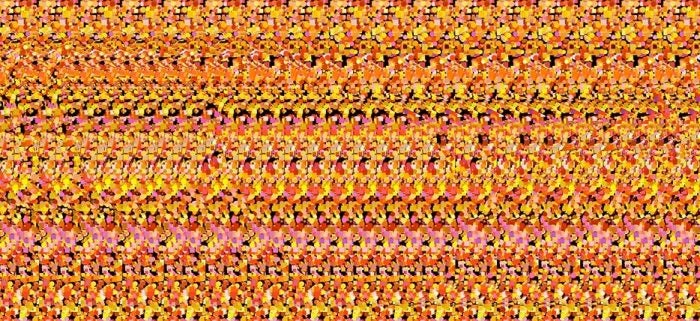
Nice! I was taught how to do it without the stereoscope, but I wasn’t very good at it. I found that it messed with my ability to refocus on the real world after I looked away from the photos. I have the same reaction after staring at those Magic Eye drawings.
|
vicali
> TheRealBicycleBuck
03/19/2019 at 14:00 |
|
Y
ep, once you stare through those for a few months you could
turn it on and
off. It’s not as easy
now, I’ve
been looking at Orthos for a long time..